Start here if you need orientation before using the link-fixing tutorial.
Recent Runs
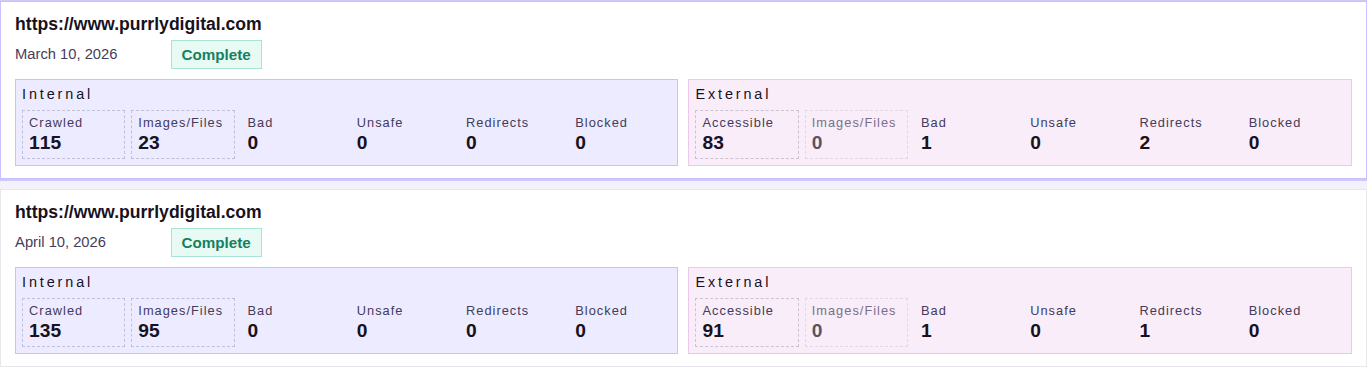
This is your starting point after every monitoring run. Each run card shows the target site, the date, a status label (Running, Failed, or Complete), and a label for the run schedule: Monthly scan, Weekly scan, or One-time scan.
The three most recent runs are visible by default. Use the “Show all runs” toggle to expand the full history.
Internal stats
Crawled — the pages we successfully reached on your site during this run.
Images/Files — internal non-HTML resources (media, scripts, downloads) that were validated.
Bad, Unsafe, Redirects, Blocked — internal findings grouped by type.
Crawled and Images/Files are clickable on completed runs. Clicking opens the Run Links modal with a paginated list of URLs from that stat group.
External stats
Accessible — external destinations that resolved cleanly.
Images/Files — external media and file resources your site references.
Bad, Unsafe, Redirects, Blocked — external findings grouped by type.
Accessible and Images/Files are also clickable on completed runs, opening the same Run Links modal for external URLs.
Working the queue
Once you understand the layout, here is how to work through findings efficiently.
Mark Fixed
Mark Fixed works at the page level. Each found-on row has its own Mark Fixed checkbox, so you can mark individual pages as you fix them without waiting to resolve every instance.
A card-level Mark Fixed button also appears when you are filtering by a specific page using the Found on page search. This lets you mark the fix for that page–URL pair without expanding the found-on list.
Ignore and Unignore
Use Ignore on a finding card to remove a URL from your active queue — for example, a known-private destination or an expected exception. The Ignored Links button in the panel header shows how many URLs you have chosen to skip, and opens a modal where you can review and Unignore any of them.
Note: Ignore and Unignore are not available to WordPress admin users.
Export Reports
Use the Export Reports disclosure in the panel header to download CSV files when you need to share findings outside the dashboard or assign work to a team. Four exports are available: Blocked CSV, Redirects CSV, Unsafe CSV, and Bad Links CSV. Each is disabled when there are no findings of that type.
Trend Snapshot
Trend Snapshot appears when you have narrowed the scope to a specific site and at least two runs exist for that site. It shows up to eight data points across recent runs, each displaying the date and counts for bad, unsafe, and redirect findings.
Use it to judge whether the queue is improving, holding steady, or growing.
Link Tasks
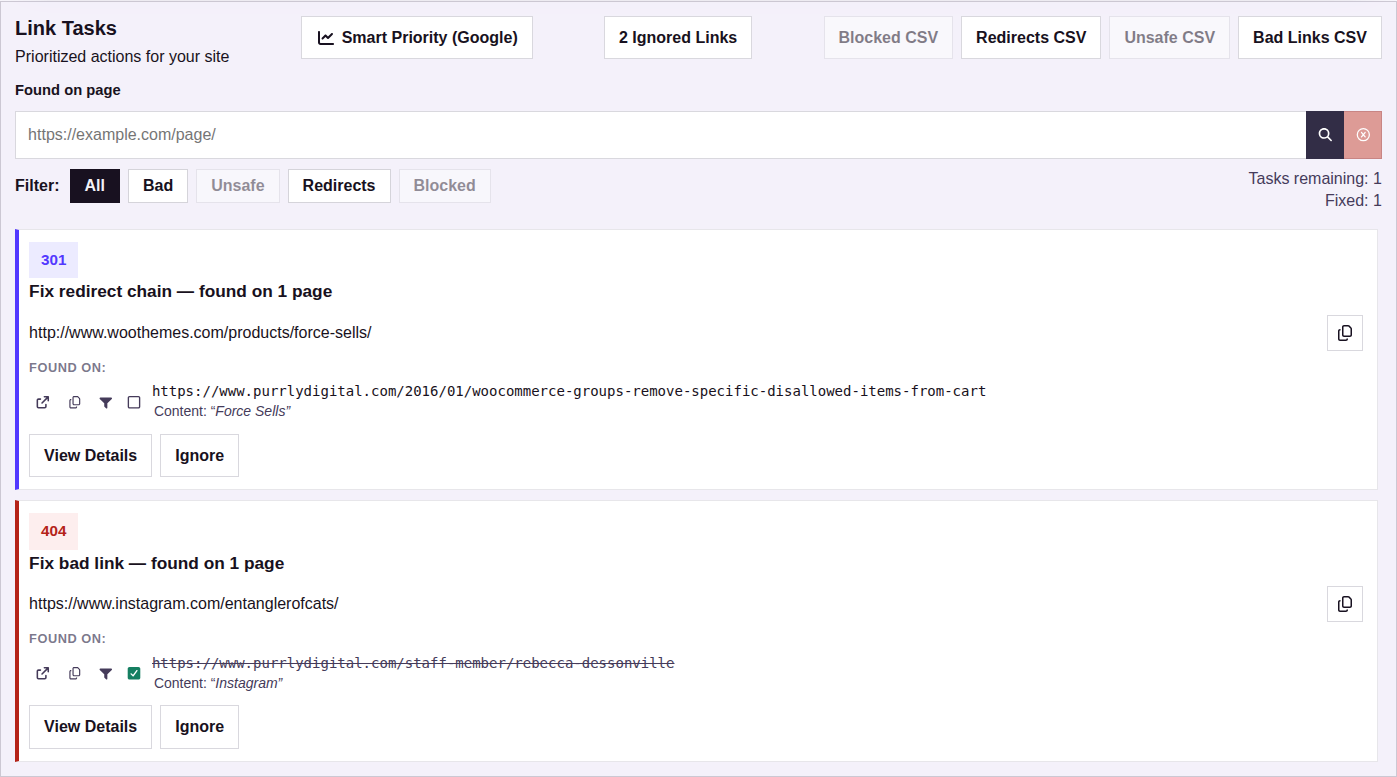
Link Tasks is your working list, with the subtitle “Prioritized actions for your site.” When you filter by page, the heading changes to “Link Tasks (filtered)”.
Panel header controls
The Link Tasks header contains three controls:
Smart Priority (Google) — opens the Smart Priority modal where you connect Google services and configure priority scoring. (See the Smart Priority section below.)
Ignored Links — shows how many URLs you have chosen to skip and opens the Ignored URLs modal. When no URLs are ignored, the button is disabled and reads “No Ignored Links.”
Export Reports — an expandable disclosure row with four CSV downloads: Blocked CSV, Redirects CSV, Unsafe CSV, and Bad Links CSV. Each download is disabled when there are no findings of that type. The row is always expanded on desktop and collapsed on mobile.
Filtering and search
Task filters — All, Bad, Unsafe, Redirects, Blocked. Each filter is disabled when there are no findings of that type.
Found on page search — enter a full or partial URL to narrow Link Tasks to findings that appear on a specific page. When active, a “Back to Pages” button appears to clear the filter and return to the full list.
Finding cards
Each card in the list represents a single URL that needs attention. A card shows:
Status label — the HTTP status code, error code, or threat type (for unsafe findings).
Priority badge — when applicable: “Not Web Safe” (P2), “Search Console” (P3), or “Analytics” (P4). Sitemap priority (P1) affects sort order and card accent color without showing a badge.
Action title — contextual text like “Fix bad link,” “Remove unsafe link,” “Review blocked link,” or “Fix redirect chain,” plus the number of pages where it appears.
URL display with a copy-to-clipboard button.
Priority context line — for P2/P3/P4 items, additional context appears below the URL: e.g., “Google flagged this link as unsafe: MALWARE” or how much search traffic the page gets.
Found-on list
Below the URL, each card lists the pages where the link was found. Each found-on row includes:
Mark Fixed checkbox — mark this specific page–URL pair as fixed.
Page URL and link text excerpt showing the anchor text used on that page.
Icons — a filter icon (narrows Link Tasks to that page), a copy icon, and an open-in-new-tab icon.
Pages where the link appears are listed below each card. When the list is long, it collapses with a toggle to show more. Links that appear across your whole site — likely in navigation or the footer — get a “Site-wide” label.
Tasks remaining
A running count of tasks remaining and how many you have marked as fixed.
Pagination
When findings exceed 50, the list paginates with Previous and Next controls. Page indicators show your position in the list.
Loading progress
A progress indicator appears while your tasks load.
Smart Priority (Google)
Smart Priority blends multiple signals to surface the findings that matter most. Open it from the Smart Priority (Google) button in the Link Tasks panel header.
What Smart Priority does for you
Smart Priority automatically sorts your task list so the most important fixes come first. It looks at which of your pages get the most visitors, which links appear in your sitemap, and whether any links have been flagged as unsafe. When you connect Google Search Console and Analytics, the sorting gets even more precise — pages that bring in real traffic from search get higher priority.
You do not need to understand the scoring — just work from the top of your list.
Connecting Google
To get the most out of Smart Priority:
- Click Connect Google (or Reconnect Google if a previous connection expired). This opens a Google OAuth popup. Note: the button is disabled unless you have a single-site scope selected.
- Once connected, use the Google property mapping panel to select your Search Console Property and Analytics Property from the dropdowns. Save your selections.
- Click Sync now to pull in the latest data from Google. This button is disabled until the connection is active.
After syncing, your Link Tasks list re-sorts based on the blended priority data, and eligible findings gain priority badges and context lines.
Issue types
Bad
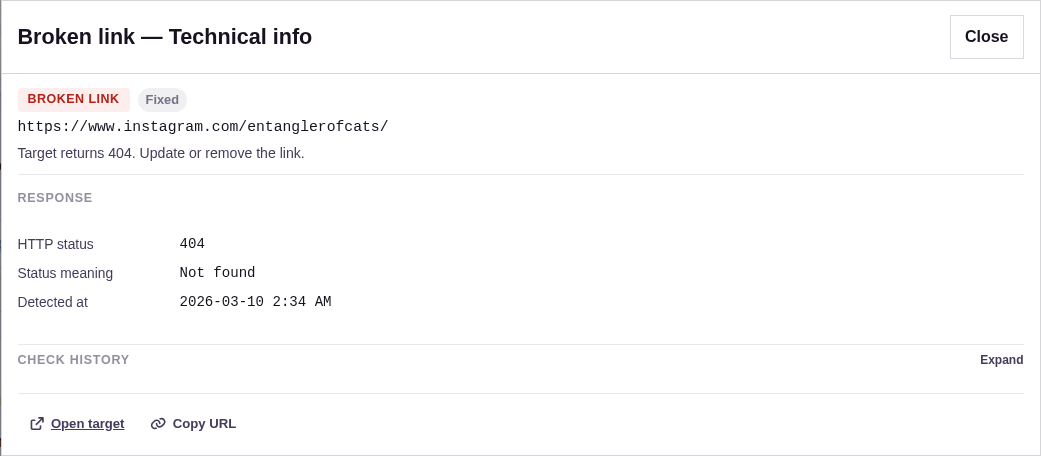
Links or resources that are not resolving correctly — HTTP errors, timeouts, and other failures. A missing page is the most common example, but the specific response varies. Open View Details to see the HTTP status code and its meaning.
Unsafe
URLs flagged by Google Web Risk for threats such as malware, social engineering, or unwanted software. Open View Details to review the threat type, Web Risk state, and matched URL before you remove or replace the destination.
Redirects
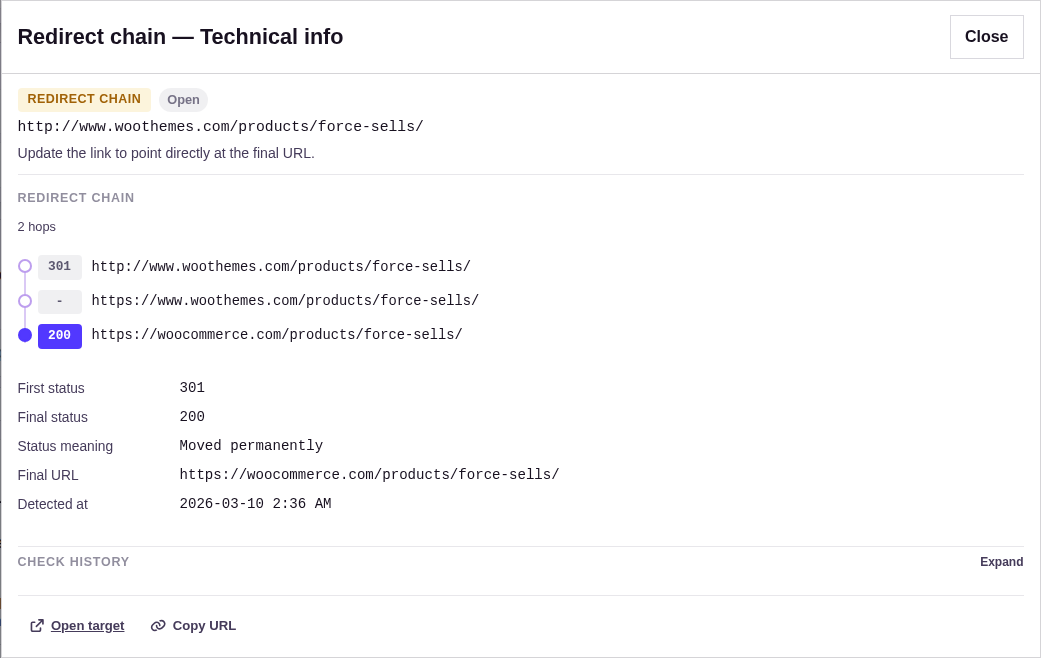
URLs that still work but take extra hops before reaching the final destination. The redirects shown here are the ones worth updating — multi-hop chains or cross-domain hops where pointing directly at the final URL will improve performance. Open View Details to see the full redirect chain.
Blocked
The destination is blocked by robots.txt, rate-limited, or otherwise inaccessible to the monitor. Confirm whether the block is expected before deciding to ignore or escalate. Open View Details to see the block reason.
View Details — Technical info
Click View Details on any finding card to open the technical info modal. The modal title reflects the issue type: “Broken link — Technical info,” “Redirect chain — Technical info,” “Unsafe link — Technical info,” or “Blocked by robots — Technical info.”
Every modal shows the type badge, priority badge (when applicable), status label (Open, Fixed, or Ignored), target URL, and a type-specific caption with guidance on what to do.
Bad — Response section
Caption: “Target returns {code}. Update or remove the link.”
Fields: HTTP status, Status meaning, Detected at.
Blocked — Robots block section
Caption: “Target is blocked by robots.txt. Replace or contact destination.”
Fields: HTTP status, Block reason, Detected at.
Unsafe — Web Risk section
Caption: “Google Web Risk flagged this URL. Remove or replace it.”
Fields: Threat type chips, Web Risk state, Matched URL, Expires at, HTTP status, Lookup error (if applicable).
Redirects — Redirect chain section
Caption: “Update the link to point directly at the final URL.”
Fields: Hop count, a visual hop timeline (ordered list showing source → intermediate hops → final destination, each with its status code), First status, Final status, Status meaning, Final URL, Detected at.